Programming Parallel Computers
Version 0: Assembly code [advanced]
In the later parts of this course it will be very helpful to be able to have a look at the assembly code produced by the compiler. This way we will get a much better understanding of how the CPU will actually see our program.
No worries, we will definitely not try to program in the assembly language, and we certainly do not expect you to understand everything that you see in the assembly code. For us, it is enough that you can find the most relevant part of the assembly code and get a rough understanding of which instructions are most relevant there.
Seeing the assembly code
To see what the assembly code produced by the compiler looks like, we can simply add the directive -S when we invoke the compiler. For example, if our implementation of the step function is in the file v0.cc, we can run:
g++ -S -g -O3 -march=native -std=c++17 v0.cc
This will produce a file called v0.s that you can open in a text editor, and it contains precisely the same code that the processor sees when it runs the program.
Finding the relevant place
Unfortunately, the assembly code that the compiler produces is often a bit hard to follow, or to even see which part of it corresponds to which part of the source code. With high optimization settings (-O3), there is no straightforward one-to-one correspondence between the source code and the assembly code.
Here is a simple trick that often helps a lot. We simply surround the innermost loop in the C++ source code with instructions such as
asm("# foo");
This basically asks the compiler to add the assembly language instruction # foo as such in the assembly code it generates. But for the assembler anything that starts with a # symbol is a comment, so the assembler will ignore this. We can, however, find these comments easily in the assembly code.
There is still a lot of additional garbage, but we can delete comments, labels (e.g. .LBB14:), and everything that is outside the innermost loop. With a bit of effort, we will see that the innermost loop consists of just 7 instructions:
LOOP:
           vmovss     (%rdi,%rax,4), %xmm0
           addq       $1, %rax
           vaddss     (%rcx), %xmm0, %xmm0
           addq       %r8, %rcx
           cmpl       %eax, %edx
           vminss     %xmm1, %xmm0, %xmm1
           jg         LOOP
How to interpret it
In the above code, %rax, %rcx, %rdx, %rdi, and %r8 are normal integer registers that hold pointers and counters; also %eax and %edx refer to the same registers. The addq instructions increment the counters, cmpl checks whether we have reached the end of the loop, and the jg instruction jumps back to the beginning if this is not the case. Nothing particularly interesting here.
The interesting part is related to the registers %xmm0 and %xmm1. These are registers that can hold floating-point numbers. Let us first rewrite the original C++ code a bit so that it is closer to the assembly code, and then put it side by side with the relevant parts of the assembly code:
| Modified C++ code | Assembly code |
|---|---|
x = d[n*i + k];
x = d[n*k + j] + x;
v = std::min(v, x);
|
vmovss (%rdi,%rax,4), %xmm0
vaddss (%rcx), %xmm0, %xmm0
vminss %xmm1, %xmm0, %xmm1
|
The compiler decided to keep the value of x in register %xmm0 and the value of v in register %xmm1. The relevant operations in the assembly code are these:
vmovss (something), %xmm0: Read a single-precision floating-point number from the memory address indicated by “something” and put it in register%xmm0. This is equivalent to the operationx = d[...]in the source code.vaddss (something), %xmm0, %xmm0: Read a single-precision floating-point number from the memory address indicated by “something”, add it to the value of register%xmm0, and store the result in register%xmm0. This is equivalent to the operationx = d[...] + xin the source code.vminss %xmm1, %xmm0, %xmm1: Calculate the minimum of the values in%xmm1and%xmm0, and store the result in%xmm1. This is equivalent to the operationv = std::min(v, x)in the source code.
Interactive assembly
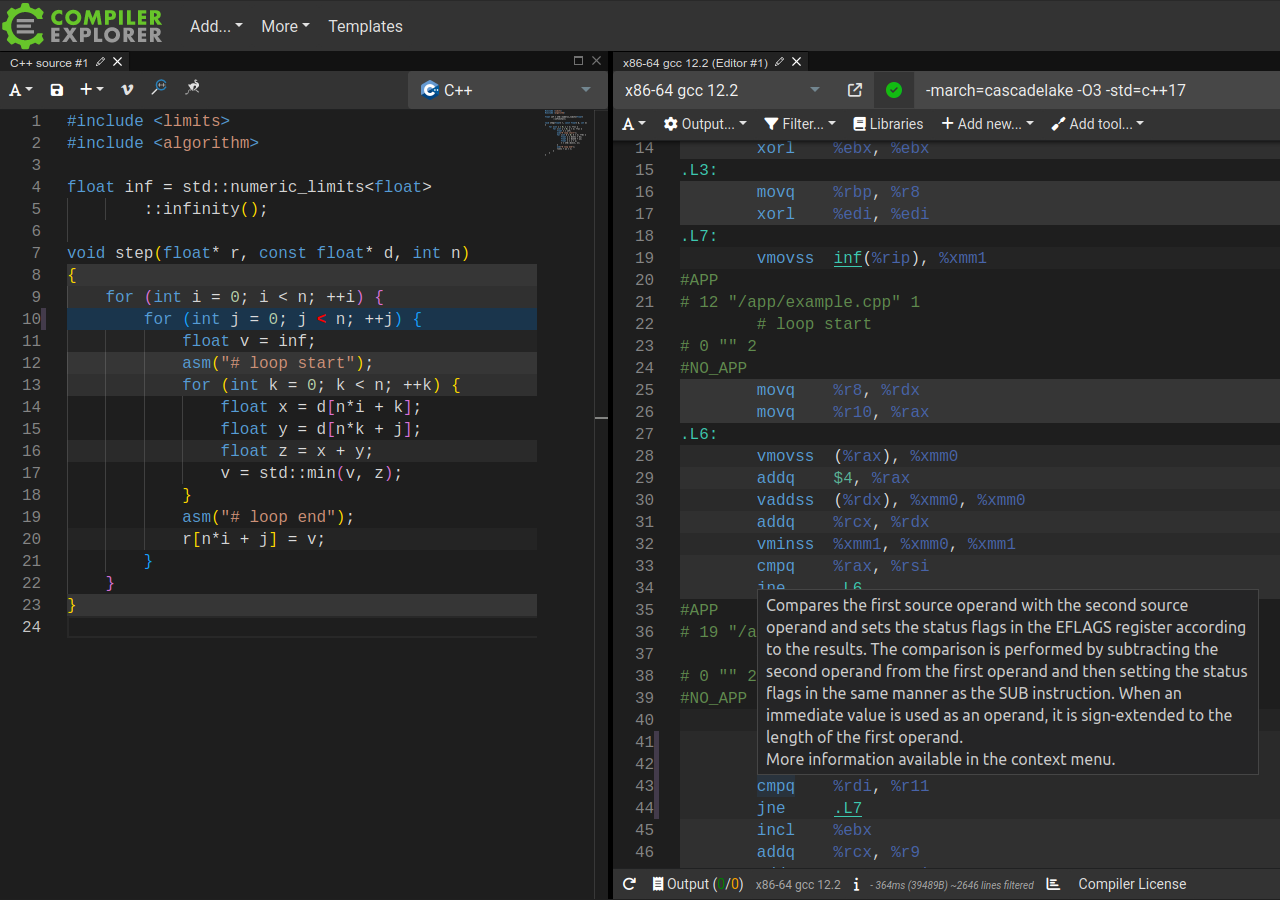
Compiler Explorer lets you interactively compare a C++ snippet and the corresponding assembly. For example, for the code presented here, Compiler Explorer shows the following:
If you want to experiment, you can edit this snippet on their website. Note also that you can hover the pointer over an assembly instruction and get a short description.
Compiler Explorer defaults to using the Intel syntax for its assembly, whereas we use the AT&T syntax. You can switch between the syntaxes by selecting Output and toggling Intel asm syntax.
